
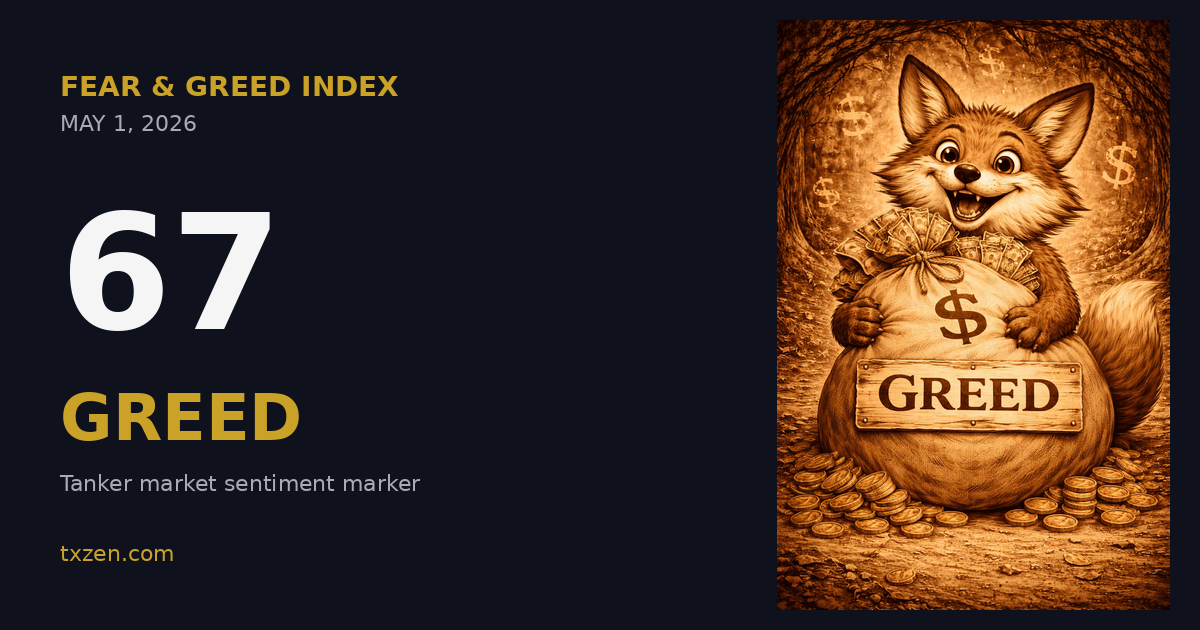
The Fear and Greed Index is 58 today
Sentiment: Greed
The CNN Fear and Greed Index reads 58 this Friday, sitting squarely in Greed territory. Our fox friend is clutching that money bag tight. Greed is driving the market again, and the move pulls the gauge back above the neutral band that defined most of the spring trade. For retail investors who watch sentiment shifts as a tactical guide, the print is a useful marker. The market is leaning bullish, but not euphorically so.
Track tanker stocks live on TradingView.
A reading of 58 is the kind of number that should make investors pay attention without panicking in either direction. It is high enough that the cheap, oversold setups of late winter are gone. It is low enough that we are nowhere near the extreme greed zone where reversals tend to happen in a hurry. Sentiment of this character usually marks the middle innings of a rally, which is the part of the cycle that rewards patience and punishes chasing.
A 58 print is the market saying it likes what it sees, but is not yet ready to declare victory.
What this reading means for the tape
The Fear and Greed Index does not predict the next day. It measures the temperature of the room. When the gauge sits in Greed for several weeks at a time, the broad market tends to grind higher with shallow pullbacks. When the gauge rips into Extreme Greed quickly, the move usually exhausts itself within a few sessions and gives back ground. Today is in the first camp, not the second. The reading climbed in measured fashion, not in a frenzy.
For tanker investors, sentiment readings of this kind are worth tracking even though the seven inputs are equity-market focused. Tanker stocks like Frontline, DHT Holdings, Scorpio Tankers, Teekay Tankers, Hafnia, CMB Tech, International Seaways, and Ardmore Shipping trade alongside the broader risk-on, risk-off cycle. A market in Greed mode is a market where small-cap and mid-cap shipping names get bid. A market in Fear mode is a market where the same names get sold first and asked questions later.
The previous close came in at 58, which means today’s print is essentially flat. That is the kind of stability that tends to confirm the underlying trend. Big sentiment moves usually precede big price moves. Quiet sentiment days usually precede the slow grind that is much harder to trade but much friendlier to long-term holders.
How the gauge gets built
The CNN Fear and Greed Index is a composite of seven sub-indicators. Each one is normalized on a zero to one hundred scale, then averaged. Market Momentum compares the S and P 500 to its 125-day moving average. Stock Price Strength tracks the number of stocks hitting 52-week highs versus those hitting 52-week lows on the New York Stock Exchange. Stock Price Breadth uses the McClellan Volume Summation Index to measure how much volume is flowing into advancing stocks versus declining ones.
The remaining four indicators are the ones that often diverge from the price-based readings. Put and Call Options measures the five-day average put to call ratio. Junk Bond Demand looks at the spread between yields on junk bonds and investment-grade bonds. Market Volatility uses the VIX, the implied volatility gauge for the S and P 500. Safe Haven Demand compares the trailing 20-day return of stocks against the trailing 20-day return of Treasury bonds. When stocks are crushing Treasuries, the gauge tilts toward greed. When the opposite is true, it tilts toward fear.
At a reading of 58, the composite is telling us that most of the components are leaning bullish but not all of them. Some weeks the gauge prints 58 because momentum is hot and everything else is neutral. Other weeks it prints 58 because every component is mildly positive. The latter is healthier. Today’s reading appears to be of the second variety, which is one reason the print held steady from yesterday.
Quiet sentiment days usually precede the slow grind that is much harder to trade but much friendlier to long-term holders.
The tanker angle
Tanker stocks have spent the last six weeks rebuilding from the spring sell-off that knocked the sector down on weak time charter equivalent (TCE) rates and softer Chinese crude buying. The recovery has been uneven. Larger names with stronger balance sheets, like Frontline and DHT Holdings, have led the bounce. Smaller product carriers have lagged. A market in Greed mode does not automatically lift every shipping name equally, but it does open the window for capital to rotate into the laggards once the leaders look extended.
That is the rotation to watch. If the Fear and Greed Index holds at this level through next week and crude tanker freight rates firm up out of the Atlantic basin, product carrier names that have been treading water could see a catch-up bid. If sentiment cracks first, the rotation never happens and the sector goes back to chopping around. Either outcome is plausible, which is exactly the kind of setup where reading the sentiment gauge each week pays for itself.
What to watch from here
Three things matter for whether this Greed reading sticks. The first is the path of the S and P 500. As long as the index stays above its 125-day moving average and breadth keeps improving, Market Momentum and Stock Price Strength stay positive contributions. The second is credit spreads. Junk Bond Demand has been the quiet bullish signal all spring. If high-yield spreads start widening, that is the early warning that the Greed reading is built on softer ground than it looks. The third is the VIX. A VIX print under 16 keeps Market Volatility on the greed side of the ledger. A move back above 20 flips it fast.
For tanker investors specifically, layer in the rate data. The weekly Baltic Dirty Tanker Index print, the Suezmax and Aframax spot rates out of West Africa and the Mediterranean, and the very large crude carrier (VLCC) Middle East to Far East trade all give a real-economy read that the sentiment gauge cannot capture. When sentiment is greedy and rates are firming together, the setup for tanker equities is at its best. When sentiment is greedy but rates are softening, the equity rally is borrowed and the giveback usually comes quickly.
How retail investors should use this reading
The honest answer is that the Fear and Greed Index is most useful as a check on your own behavior. When the gauge is in Extreme Fear, ask yourself whether you are about to sell something you spent months building a position in because the screen is red. When the gauge is in Extreme Greed, ask whether you are about to add to a position that is already up 30 percent on the year because everyone on financial Twitter looks smart this week. Mid-Greed readings like today are the easy ones to ignore. That is part of why they are dangerous. They do not feel like a turning point until they already are.
The practical use for tanker investors is to overlay the index on the spot rate cycle. If the gauge is in Greed and Suezmax rates are climbing week over week, ride the names that have positive earnings revisions. If the gauge is in Greed and rates are flat, focus on the balance sheets and dividend coverage. If the gauge is in Fear and rates are still climbing, that is often the best risk-adjusted entry the cycle gives you, because price and sentiment are dislocated from the underlying fundamentals.
Today is the first scenario. Sentiment is firm, rates are firming, and the tanker watchlist is still pricing in some of the spring fear that has otherwise faded out of equity indices. That gap is the opportunity, but it does not stay open forever. The longer this Greed reading lingers, the faster that gap closes.
Yesterday’s close: 58.
Data sourced from CNN Business. Posted automatically by StemGauge every Friday.